Pages

Download SAP Certification Material for FREE @ http://sap-ebooks-den.blogspot.com

Thursday, November 25, 2010

Java Engine Administration Tools

(Click on the image above to view large)

Visual Administrator: Remote monitoring and management of managers, services, libraries, and interfaces of each element of an instance.

GUI Config Tool: Offline configuration of the J2EE Engine cluster elements.

Text-Only Config Tool: Offline configuration of the J2EE Engine cluster elements.

Configuration Editor: Configuration of the current state of the Configuration Database.

Shell console Administrator: Text based alternative to the Visual Administrator.

Software Deployment Manager: Manage and deploy software packages.

System Info Page: Overview of System Configuration and its state.

Logfiles Startup J2EE Instance


Log files: The important log files involved in the startup process.

Most of the log files are located in the directory
Unix : /usr/sap//<>/work
Windows : c:\usr\sap\\<>\work

Some of the sapstart logfiles are located in the home directory of the user directory

The startup process has run correctly for the dispatcher and server instances if status 3 is reached
in dev_dispatcher : JLaunchISetState: change state from [Starting (2)] to [Running (3)]
in dev_server0 : JLaunchISetState: change state from [Starting applications (10)] to [Running (3)]

Log files types:
dev* Tracefile of Process
std* Standardoutput
jvm* Messages of the Java VM

JControl and JLaunch


JControl – Java Instance Controller


JControl: A native program that starts, stops, and monitors the processes of a Java instance (usually a dispatcher and several server processes). The program implements the SAP signal handling to stop the instance. JControl starts the JLaunch processes.

JControl controls J2EE processes …
JControl is the master process of all J2EE worker processes
Controls the lifecycle of the J2EE instance
Restart of crashed processed
Termination of hanging processes
Sends shutdown signal to instance processes
responsible for starting the processes in the right order (bootstrapping..)
integration of different processes into one J2EE instance (SDM, ICM, ...)
provides the monitoring information in a shared memory segment
supports SAP profiles to share configurations with the ABAP Stack


JLaunch – Java Program Launcher


JLaunch has following tasks:
Read the properties of the program to host
Read the VM properties from the database during startup process
Attach to the administration shared memory segment
Load the shared library of the Java VM

JLaunch starts a Java program. It loads the JVM into its own address space and then represents the required cluster element. The program can receive from notification from the JControl process via named pipes to stop the cluster element, and terminates, if the JControl stops running (fork emulation under Windows).

Wednesday, November 24, 2010

JCMon – Monitor Program


Command line tool
Overview about the instance and process state
Local administration menu for the local instance and their processes
Cluster administration menu for remote operations
------------------------------------------------------------
SAP System Name : C11
SAP System : 00
MS Host : pcj2ee01
MS Port : 3601
Process Count : 4
PID of JControl : 7244
State of JControl : All processes running
State inside MS : All processes running
Admin URL :
------------------------------------------------------------

|Idx |Name |PID |State |Error|Restart|
|--- |------------------- |--------|--------------------|----- |------- |
| 0 |server0 | 5784 |Running | 0 |yes |
| 1 |server1 | 2216 |Running | 0 |yes |
| 2 |dispatcher | 4748 |Running | 0 |yes |
| 3 |SDM | 436 |Running | 0 |yes |
------------------------------------------------------------

Jcmon is a J2EE instance monitor program.
To start jcmon enter with the adm user
(a) jcmon pf=/usr/sap//sys/profile/__.
(b) Enter command ‘20’ to display the main menu.


Start/Stop of Java Engine processes in ICM Monitor


You can use the ICM to manage the Java Engine as well. You can find the functions in the ICM monitor (Transaction SMICM or by choosing Administration → System Management → Monitor → System Monitoring → Internet Communication Manager) choose Administration → J2EE Server on the initial screen.

The following functions are available:

-> Sending a Soft Shutdown (With or Without a Restart):
The (ABAP) dispatcher of the SAP Web Application Server sets the restart flag for the J2EE
Engine and sends the SOFTSHUTDOWN message to the J2EE Engine. The dispatcher does
not actively close the connection, the J2EE Engine must close itself instead. If the application
server is restarted, the J2EE Engine is restarted by the dispatcher.

-> Sending a Hard Shutdown (With or Without a Restart):
The (ABAP) dispatcher of the SAP Web Application Server sets the restart flag for the J2EE
Engine and sends the HARDTSHUTDOWN message to the J2EE Engine. The dispatcher
does not actively close the connection, the J2EE Engine must close itself instead. If the
application server is restarted, the J2EE Engine is restarted by the (ABAP) dispatcher.

-> Ending the Process (With or Without a Restart):
The SAP Web Application Server’s dispatcher sets the restart flag for the J2EE Engine and
sends a signal to the process (shell or Java process). If the application server is restarted, the
J2EE Engine is restarted by the dispatcher.

-> Restart Yes/No
This sets the J2EE Engine’s restart flag.


Starting and Stopping SAP with scripts (UNIX & Windows)


Starting the SAP System
startsap [db|r3|j2ee|ccms|all|check] [] []

Examples
startsap - to start the whole system
startsap j2ee DVEBMGS00 - to start the J2EE-Engine of the instance DVEBMGS00. The instance name is required if more than one instance is configured.
startsap r3 - to start only the ABAP part of the system

Stopping the SAP System
stopsap [db|r3|j2ee|ccms|all|check] [] []

Examples
stopsap - to stop the whole system
stopsap j2ee DVEBMGS00 - to stop the J2EE-Engine of the instance DVEBMGS00. The instance name is required if more than one instance is configured.
stopsap r3 - to stop only the ABAP part of the system


􀂃 The start and stop of the SAP system are done using the scripts startsap and stopsap in the exe directory.
􀂃 You have to be logged on to the SAP system hosts as user adm.
􀂃 If there are multiple SAP instances on one host – for example, a central instance and a dialog instance you have to add an extra parameter to the scripts:
􀂃 startsap ; stopsap
􀂃 For example, enter: startsap DVEBMGS00
􀂃 SAP Web AS J2EE only system: The instance name (instance ID) of the central instance is JC, the instance name of a J2EE dialog instance is J.
􀂃 To view all the processes use command: ps -ef | grep jlaunch

J2EE Startup Framework


The J2EE Startup and Control Framework

􀂄 … is an infrastructure, situated between the operating system and the Java VM
􀂄 … is used to start, stop, and monitor a Java Instance
􀂄 … loads the JVM and restarts processes, which have died/crashed
􀂄 … comprises the programs Jcontrol, Jlaunch and Jcmon

The Java startup and control framework comprises the programs JControl and Jlaunch. JLaunch is started by JControl and itself starts the bootstrap Java program or an element of the Java Instance (dispatcher or server process). Whereas the Jcmon is a command line monitor program and is used to administrate the framework.

Java startup and control framework is used to start, monitor, and stop a Java instance:
􀂋Integration of Java Processes into the SAP instance concept
􀂋Inherit all management concepts from the ABAP stack
􀂋Integration into existing SAP instance management
􀂋Control and Restart functionality of J2EE processes (Watchdog)
􀂋Daemons for NT (sapserv.exe)
􀂋Remote Control of all J2EE instances in the cluster
􀂋Cluster wide management (shutdown, restart ...)
􀂋Integration of the Startup Framework Client into the IDE
􀂋Preparation of Remote Debugging Support

Monday, November 1, 2010

J2EE Engine - Profile Parameters

icm/HTTP/j2ee_ Determines the ICM’s communication with the J2EE Engine.

Exe/j2ee full path to JControl

rdisp/j2ee_error Number of incorrect attempts to start a J2EE Engine before the restart is deactivated.

rdisp/j2ee_start Activates or deactivates starting the J2EE Engine.

rdisp/j2ee_start_lazy
- If 1 and if the rdisp/j2ee_start is set - the J2EE Engine it is not started until the ABAP runtime environment has been fully initialized. This avoids problems that are caused by a long initialization phase.
- If 0 (default) – the J2EE Engine can be started without waiting for the ABAP initialization.

rdisp/j2ee_timeout Time span, the J2EE Engine must log on to the Web Dispatcher.

SDM Instance


Software Deployment Manager (SDM)

SDM Server
􀂋 started automatically as part of WEB AS 6.40
􀂋 one SDM Server per WEB AS 6.40 with J2EE Engine is necessary

SDM Interfaces
1) Commandline Interface (sdm.bat or sdm.sh)
(a) A new SDM process is started each time a command is executed
(b) No SDM Server may run at the same time (this is checked).

2) JAVA API (SDMclient.sda) needs a running SDM Server

3) SDM Gui (sdmgui.bat or sdmgui.sh) needs a running SDM Server
  • Another special instance is the one that installed the SDM (Software Deployment Manager). This one usually runs with the database and Central Services on the same machine and is then indicated as the central instance.
  • The Software Deployment Manager (SDM) is a tool with which you can manage and deploy software packages that you receive from SAP or created with NetWeaver Developer Studio.
  • The Software Deployment Manager (SDM) groups several different deployment types in a single network interface for the deployment of any software that you develop with the SAP NetWeaver Developer Studio.
  • In all modes SDM is only able to handle one access at a time.

Java Instance – Server Process


Server Process components:

Connection request handler receives the first request from a client. From this time point on, the client has a fixed connection to the dispatcher.
Session level services are services that are assigned to a session.
Application-level services or the actual application program.

1) The Server Processes of the J2EE Engine actually execute the J2EE application.
Each server process is multi-threaded, and can therefore process a large number of requests simultaneously. Java Dispatcher assigns requests to the server processes.

2) The identification of the jlaunch processes can be easy done with their PID, the PID is also represented in the monitoring tools as the SAP Management Console.

Java Instance – Java Dispatcher


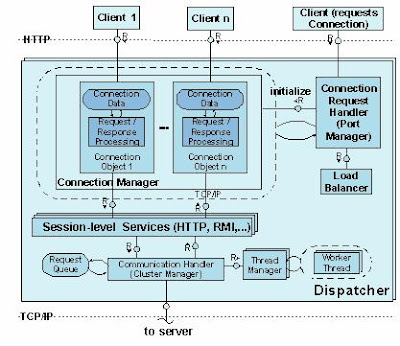
Java Dispatcher components:

Connection request handler receives the first request from a client. From this time point on, the client has a fixed connection to the dispatcher.

Connection manager manages the existing connections to the clients.

Session level services are services that are assigned to a session.

Communication handler forwards the request to the server process.
Accumulating requests are stored in the request queue.


1) A Java instance is a unit in the SAP Web Java cluster, which can be started, stopped, and monitored separately. It runs on a physical server; but it is also possible to run several instances on one server. An instance is identified by the system ID (SID) and the instance number.

2) One Java instance contains at least one Dispatcher and one Server Process, the Central Services (Message, Enqueue) and the SDM.

3) A Java instance is started and stopped by the Java Startup and Control Framework.

4) The Java dispatcher receives the client request and forwards it to the server process with the lowest capacity usage. If there is already a connection to the client, the request goes to the server process that processes this client.

5) Dispatcher processes are represented by a jlaunch processes

6) The Java Dispatchers do not communicate to each other, they are light applications used for load balancing to the local servers only.

7) Interprocess communication Dispatcher on one box – Server on other box is not possible.

Locking Adapter in the Visual Administrator


With the Locking Adapter checks and tests of the Enqueue Service can be done.

􀂄 The locking adapter service establishes the interface between the J2EE Engine and the enqueue service.
􀂄 You can display and manage locks, carry out tests, and display statistics.
􀂄 The locking adapter service is available on each server process, but it is not available on the dispatcher. It connects to the Enqueue Service and fetches requested data or sends changed data to it. As there is only one enqueue server in the system, all the locking services of the various server processes have the same information. Therefore it is not important on which
server process you use the locking adapter service.
􀂄 Locks are used for example during deployment of applications. The configuration manager requests a lock from the Locking Manager. The Locking Manager in turn requests the lock from the Enqueue Service. The relevant area in the database is locked

􀂄 To look into the Locking Adapter use the following path:
1. Start the SAP J2EE Engine visual administrator.
2. Choose Cluster -> Server 0 -> Services
3. Choose Locking Adapter
Choose the Runtime tab page to see a list of the functions offered in the locking adapter service:
􀁺 To display existing locks; choose Display Locks.
􀁺 To set and release locks, choose Create/Release Lock.
􀁺 To delete existing locks, select the locks and choose Delete Selected Locks.
􀁺 To run test programs, choose Run Tests. To run functional tests choose Execute Functional Tests, and to load tests choose Execute Load Tests).
􀁺 To display files, choose View Files. You can view the profile data or the trace file of the lowest layer of the enqueue service. This is useful for looking for errors.
􀁺 To display statistics, choose Time Statistics.

Thursday, October 21, 2010

Central Service - Enqueue Service


Enqueue Service manages logical database locks, which are set by the executed application program in a server process.
Enqueue Service synchronizes data across the cluster.


  • The Enqueue service runs on the Central Services instance of the Java cluster. It manages the lock table in the main memory and receives requests for setting or releasing locks.
  • It also maps the logical locks to the database.
  • The Enqueue service can be configured for high availability, by setting it up with the replication server and a platform-independent high availability solution.
  • The status of the Enqueue service are made accessible to the administrator via the Locking Adapter Service in the Visual Administrator.
  • The terms Enqueue server and Enqueue service are used synonymously. The correct expression is that the Enqueue server is the program or process that provides the Enqueue service.
  • Enqueue Service is represented by an en.sap process


Message Info Service in the Visual Administrator


  • The message info service is the interface between the J2EE Engine and the Message Service, it is used it to monitor and administrate the message server.
  • The message service doesn’t communicate direct to the Message Server, but it is using the cluster manager, which has a direct connection to the message server.
  • The message info service is not automatically started when the J2EE Engine is started.

It should be started manually:
Using the SAP J2EE Engine visual administrator.
1. Choose Cluster → Server 0 → Services
2. Choose Message Info
3. Choose Start Service in the toolbar

Using the telnet console.
1.In the console where the server process is running, enter the command: startservice msp

• The Message Info Service data should be used mostly for supportability purposes, be careful

Web AS Java Cluster Architecture


One Java Engine installation consists of:
􀂄 One or more Java instances (Java Dispatcher, Server) and the Software Deployment Manager (SDM)
􀂄 The Central Services (Messaging Service, Enqueue Service), which also create an instance (Central Instance)
􀂄 Ax external database.

Changes in architecture of J2EE – Engine are made since 6.20
􀂄 A J2EE Cluster now consists of an Central Service Instance. One Central Service Instance is required in the J2EE Cluster.
􀂄 The Configuration of the J2EE Engines are now stored in a Database. Not any more stored in XML-Files in the file system. A database for the J2EE Cluster is required.
􀂄 An Startup and Stop Framework is used.

In a large Java cluster installation, the load is distributed from a load balancer onto the different Java dispatchers.


Central Service - Message Service

Tasks of the Message service:
􀂄 Notification of events that arise in the cluster.
􀂄 Communication between different services
􀂄 Forwarding of messages and requests to all participants (broadcast)
􀂄 Prepare logon information for the SAP Web Dispatcher
􀂄 Support for message server failover
􀂄 Guaranteed message transmission
􀂄 Exchange of cache information in the cluster


􀂄 The Central Services run on one physical server and are one Java instance. They comprise the Message service and the Enqueue service.

􀂄 The Central Services form the basis of communication and synchronization for the Java cluster.

􀂄 Central Services are always required when a Java cluster is installed. They are started on a server with their own system number and the system ID (SID) of the whole system.

􀂄 When Central Services are running, further Java instances (Dispatcher, Server) are started with the program JControl

􀂄 The message service is a separate program used for communication between the elements of a Java cluster. It keeps a list of all processes (dispatchers and server) of the Java cluster. It represents the infrastructure for data exchange (small datasets only) between the participating nodes. The message service also supplies information to the SAP Web Dispatcher about Load Balancing.

􀂄 Processes on Operating system level
NT : msg_server.exe
UNIX: msg_server

􀂄 Trace file:
dev_ms in work directory of Central Service Instance

􀂄 The settings and the status of the message service are made accessible to the administrator via the message Info Service in Visual Administrator described bellow.

􀂄 Message server and Message Service are used synonymously. The correct expression would be that the Message Server is a process or program that provides the Message Service.


References :
TADMJ1 - SAP Java Engine Administration
ADM200 - SAP Web AS Java Administration

Download TADMJ1 & ADM200 from http://ebookssap.blogspot.com

Tuesday, August 31, 2010

Displaying Error Codes in livecache

       1.      In the user menu, choose liveCache Assistant (transaction LC10).

       2.      Enter the name of the database connection.
You can select the name from the list of existing names. You can restrict the search for the required name.

       3.      Choose liveCache ® Monitoring.

       4.      If no start application is displayed, or if you exit the application with Back, Exit, or Cancel, you can choose Utilities ® Error Codes in the menu.
 

Managing liveCache Connections in the liveCache Alert Monitor

Calling up the liveCache Alert Monitor using the liveCache Assistant user menu usually activates the Alert Monitoring and the liveCache connection is added to the liveCache Alert Monitor Tree.

It may be necessary to update the liveCache Alert Monitor display. To do this, choose Refresh and Invalidate Data Cache in the liveCache Alert Monitor.

In some special cases you may choose or have to administer the liveCache connection in the liveCache Alert Monitor manually. In these cases you can use the report RSLVCALMON.

Adding a liveCache Connection to the liveCache Alert Monitor

Execute the report RSLVCALMON.

       1.      Choose ABAP Editor (transaction SE38).

       2.      Enter RSLVCALMON.

       3.      Enter the name of the database connection

As an alternative to starting the report, you could also start the central instance.

The liveCache Alert Monitor is started and the liveCache connection is added. It may be necessary to update the liveCache Alert Monitor display. To do this, choose Refresh and Invalidate Data Cache in the liveCache Alert Monitor.
 

Deleting a Database Connection from the liveCache Alert Monitor

Execute the report RSLVCALMDEL.

       4.      Choose ABAP Editor (transaction SE38).

       5.      Enter RSLVCALMDEL.

       6.      Enter the name of a database connection.


liveCache Alert Monitor

liveCache Alert Monitor used to identify memory problems in good time, to check the security of your liveCache database instance and to monitor performance.

If data collection methods are periodically scheduled, alerts are automatically updated and forwarded to the monitoring tree. Analysis methods deliver additional information about the alert statuses, and auto-reaction methods can be configured for automatic reactions to new alerts.

Integration

You can use the following start options:

     Alert Monitor
In the liveCache Assistant, choose
liveCache ® Alert Monitor ® MaxDB Monitoring ® liveCache.
or
In the liveCache Assistant, choose
liveCache ® Monitoring ® Alert Monitor ® MaxDB Monitoring ®
liveCache.
The Alert Monitoring is activated and the liveCache connection has been added to the liveCache Alert Monitor.

     CCMS Monitoring
If Alert Monitoring is not activated (for example, when accessing liveCache alert monitor in the liveCache assistant), you should activate the alert monitor and add the liveCache connection to the liveCache alert monitor (see below: Managing 
liveCache Connection in the liveCache Alert Monitor)
Choose
SAP CCMS Monitor Templates for Optional Components ® MaxDB Monitoring ® liveCache in CCMS Monitoring
 

Nodes

Every monitored element of the liveCache is displayed as part of a hierarchical tree (monitoring tree) and described as a monitoring tree element (MTE), or node. Online help (short and long texts) gives you the most important information about each node.

You can choose from the following displays for each liveCache node in the monitoring tree:

     Properties

     Space Management

     Performance

     Backup/Recovery

     Health

     liveCache Applications

     External Analysis Tools


Colors of the Alerts

     Green displays mean that the liveCache state is OK. The administrator does not need to intervene.

     Yellow or red displays mean that this state is putting production operation of the liveCache database instance at risk. The administrator must take measures to find and eliminate the cause of the alert.


Tuesday, August 3, 2010

Increasing liveCache Performance


􀂄 To improve liveCache performance, the first step is to optimize the setting of the liveCache configuration parameters

􀂄 If a shortage of main memory or CPU performance is detected, you should enlarge the main memory or increase the number of CPUs.

􀂄 If you cannot find out why the performance is poor, call SAP Active Global Support and ask for an SAP APO/liveCache specialist.


Relevant SAP Notes 490958 and 496318


Download ADM555 - LiveCache Administration - http://www.easy-share.com/1905354899/ADM555

Download SAP eBooks - http://ebookssap.blogspot.com


Configuration Parameters for liveCache 7.4

􀁺

CACHE_SIZE

Size of the global I/O buffer cache in pages (8 KB)

􀁺

OMS_HEAP_LIMIT

Maximum size of OMS cache in KB

􀁺

MAXCPU

Maximum number of CPUs used by liveCache UKTs with user tasks

􀁺

MAXUSERTASKS

Maximum number of connections

􀁺

MAXDATADEVSPACES
Maximum number of data devspaces used by the current liveCache
 

Note : For the latest liveCache parameter recommendations, check SAP Notes 490958 and 496318


Memory configuration parameters CACHE_SIZE, OMS_HEAP_LIMIT:

􀁹

Adjust the sizes according to the current or expected data volume.

􀁹

If the SAP APO system is not yet in production, use the SAP Quick Sizer to calculate the expected data volume.

􀁹

In liveCache 7.4, parameter OMS_HEAP_LIMIT should not be set to 0.

- In live Cache 7.2, the recommended value was 0.


SAP APO liveCache Monitoring


External Heartbeat

The collector uses an external program (DBMCLI) to periodically check if an SAP instance is able to access liveCache. A red alert is generated when a failure occurs.

Heartbeat

liveCache can have a number of statuses. liveCache is working properly when it has a status of "WARM." By default, the status is checked every 5 minutes; however, this value is userdefinable. A red alert is generated if any other status then "WARM" is detected.

System Error Messages

At user-definable intervals (the default is every 5 minutes), the collector reads the System Error Message log file. Every error message is reported as a red alert. A customization table is used to suppress notification of specific error messages and/or to modify how error messages are evaluated.


Synchronous BAPI Logging & Archive Logging

A customization table is used to set the logging level ("liveCache logging switched off," "synchronous logging turned on") and the archive logging (ON/OFF) for each client. A red alert is generated as soon as the actual value deviates from the default.

Connection to liveCache

The connection to liveCache is checked according to the specified interval. In addition to the connection tests, the system also checks if the appropriate entries for LDA (primary connection for multi-connect) and LCA (secondary connection) are present in the DBCON table.

OMS Data Cache, Converter Cache

The Object Management System (OMS) stores and manages the business objects. The data blocks are stored in cache for rapid access, and the references to the physical blocks are stored in the SYSTEMDEVSAPCE. Storing the references in the so-called converted cache enables them to be accessed more quickly. After each run, the collector reports the actual OMS data cache usage values and hit ratio as well as the hit ratio for the converter cache.

These values can be used for creating a performance graphic.


Status Checks

The collector periodically checks the status of:

Database Full YES/NO

Diagnosis Monitoring ON/OFF

Monitoring ON/OFF

Vtrace ON/OFF

A red alert is generated as soon as the actual value deviates from the default, which is black and bold.


Initialization Log File

The initialization log file is refreshed every time liveCache is started and initialized. The collector searches the last log file for errors. The strings that the collector searches for in the log file are defined in a customization table. The "*" (asterisk) wildcard can be used in the string definitions. The alert threshold can be determined at the string level.


Functional Check / Simulation

A report is used to check liveCache's function ability. Test data is written to and read and deleted from the LC. A red alert is generated if an error occurs during the simulation. The last erroneous log file is always saved so that analyses can be performed at a later stage.

COM Routines

Application functions are implemented in liveCache as C++/COM routines. These functions enable the objects to be modified directly in memory.

Trace Level

The collector checks if at least one trace level is active. A red alert is generated when an active trace level is found.

Runtime (COM routines)

A COM routine's average runtime can provide an indication of the system's utilization. A customization table is used to define a COM routine's average response time. A red alert is generated when a defined response time is exceeded.


SAP APO CIF Monitoring

qRFC Ping

This connection test is twofold: First the availability of the connection to the APO clients is tested in the APO system itself, and then the so-called external CIF connections (RFC lines) of the R/3 systems that are connected to APO are tested. The collector automatically recognizes all of the connections that need to be tested and requests them periodically based on a user-definable interval (the default is 5 minutes). A red alert is generated if a connection failure is found.

qRFC Queue Length

Among other things, the number of entries per destination queue provides an indication of the APO system's processing speed. If there are problems processing a queue, the jobs may be assigned to another queue. Threshold values that determine the number of queue entries that are required to generate a yellow or red alert are specified in a customization table. The collector is scheduled to run at user-definable intervals (the default is 5 minutes).

qRFC Queue State

A queue that is being processed can show a number of statuses. The collector checks if a queue has a failure status, in which case a red alert is generated.
 

qRFC Runtime

The runtime of a queue's job also provides an indication of the APO system's processing speed. If a queue's currently active job exceeds a pre-defined runtime (e.g. APO's upload program has fallen into an endless loop or the process has halted) a yellow or red alert will be generated based on the settings. By default, a yellow alert is generated is the job's runtime exceeds 5 minutes and a red alert is generated if the job's runtime exceeds 15 minutes. Both of these threshold values are user-definable.

Logging/Debugging

The collector checks the current logging and debugging settings of the user that is registered in the RFC connection for all CIF connections. Logging and debugging default values can be individually defined for each user. A red alert is generated as soon as the actual value deviates from the default.

Consistency of the SAP Core Interface (CIF)

The collector checks the consistency of the SAP Core Interface. For the check, the data collector examines the APO-specific tables for  inconsistencies. If inconsistencies will be found the data collector generates alerts providing information about how many inconsistencies have been found and which logical systems (SAP R/3) are affected.


Tuesday, July 6, 2010

SAP MaxDB - Defining Backup Templates


Before you can back up data and log entries to a data carrier, you have to define a backup template. In the properties of the backup template you specify the backup type and the type of data carrier that is to be used.

To speed up backups, you can carry them out to several data carriers in parallel. If choose to do so, you need to define a backup template for parallel backups. You can use third-party backup tools to back up and restore data and log entries

-> You have to logon the database as the database system administrator or as a DBM operator with server authorization for performing backups

Procedure

  1. Select the database in the explorer tree.

  2. In the context menu of the database, choose Administration.

  3. Open the Backup tab page.

  4. Expand Templates.

  5. Choose New.... .

    To create a backup template for parallel backups, choose  New   New Parallel Backup Template . Then proceed as with normal backup templates, except that you define several devices instead of one. For backups of the TAPE type, you can use up to 32 tape devices in parallel.

  6. Enter the following data:


Backup Template Properties

Property


Description


Name


The name of the backup template has no influence on the name of the backup created later using this backup template.


Backup Type


  • Complete data backup

  • Incremental data backup

  • Log backup


Device Type

Data carrier type

  • File

  • Tape

  • Pipe

     Note

    For automatic log backups, you cannot use pipes.


Backup Tool

Only if you are using a third-party backup tool

Specify the backup tool:

  • BACK: Backint for Oracle or Backint for MaxDB

  • NSR: Networker

  • TSM: TSM


Device/File

Depending on the backup type enter the required information:

  • Name of the tape device in the operating system

  • Path and file name of the file in the file system

     Caution : If you do not enter a full path here, the system stores your backup in the run directory of the database.

  • Path and name of the pipe

We recommend that you do not use the same data carrier for several databases.

For log backups to files, the system adds a sequence number to the name of each new backup file. It assigns the numbers sequentially as long as the history of the log backups is not interrupted. If the log backup history is interrupted (for example after the database was initialized), the system starts numbering at 001 again.

It also uses sequential numbers if you carry out multiple log backups for one database onto different data carriers, and thus to files with different file names.

 Example

LogUri.001

LogKai.002

LogOleg.003

LogUri.004

LogUri.005

End of the example.

If automatic log backup is switched on, the system stores all backup files under the same file name using a sequence number.

 Example

DEMODB_MYLOG.001

DEMODB_MYLOG.002

DEMODB_MYLOG.003

DEMODB_MYLOG.004

DEMODB_MYLOG.005


You can also back up to data carriers on remote computers.


Size

There is no size restriction in default mode.

The size of log backups to files is calculated as the size of a log segment (general database parameter AutoLogBackupSize) plus the space required by system information.


Compressed

For backup templates of the FILE and PIPE types only

Specifies whether the backup is compressed


Overwrite

For backup templates of the FILE type only

Specifies whether the backup file can be overwritten

We recommend that you do not overwrite a backup with the backup that immediately follows it. Always keep an older version of the backup.


Block Size


Block size that the system uses to write backups to the data carrier.


Autoloader


Select this option if you want to use a tape device with an automatic tape loader.


OS Command


For backup templates fo the TAPE type only

Operating system command for backing up to tape devices


Encryption

Prerequisites: license for SAP Cryptolib (only available in SAP systems), private-public key pair has been created using sapgenpse

  • Algorithm

    Available encryption algorythms: DES, AES

  • Owner

    Private key owner (see X.509 certificate)


To use a third-party backup tool, choose the following settings:

  • Device Type: Pipe

  • Backup Tool: Name of the backup tool

  • Device/File: Operating system path of the pipe


More Information SAP MaxDB - Using Third-Party Backup Tools


Example of a Backup Template for a Complete Data Backup

Property

Value

Name of the backup template

COM

Backup type

COMPLETE DATA

Data carrier type

FILE

Data carrier (Device/File)

DEMODB_COM

Note that if you do not enter an absolute path, then the database system uses the run directory of the database

Example: C:\ProgramData\sdb\globaldata\wrk\DEMODB\DEMODB_COM


Size of data carrier

No restriction (blank or 0)

Block size

8 pages

Overwritable

Yes


Example of a Backup Template for a Log Backup

Property

Value

Name of the backup template

DEMODB_LOG

Backup type

LOG

Data carrier type

FILE

Data carrier (Device/File)

DEMODB_MYLOG

Note that i you do not enter an absolute path, then the database system uses the run directory of the database

Example: C:\ProgramData\sdb\globaldata\wrk\DEMODB\DEMODB_LOG


Size of data carrier

No restriction (blank or 0)

Block size

8 pages

Overwritable

No


Related Posts Plugin for WordPress, Blogger...